Charlar Acar | November 9, 2026
Market Update

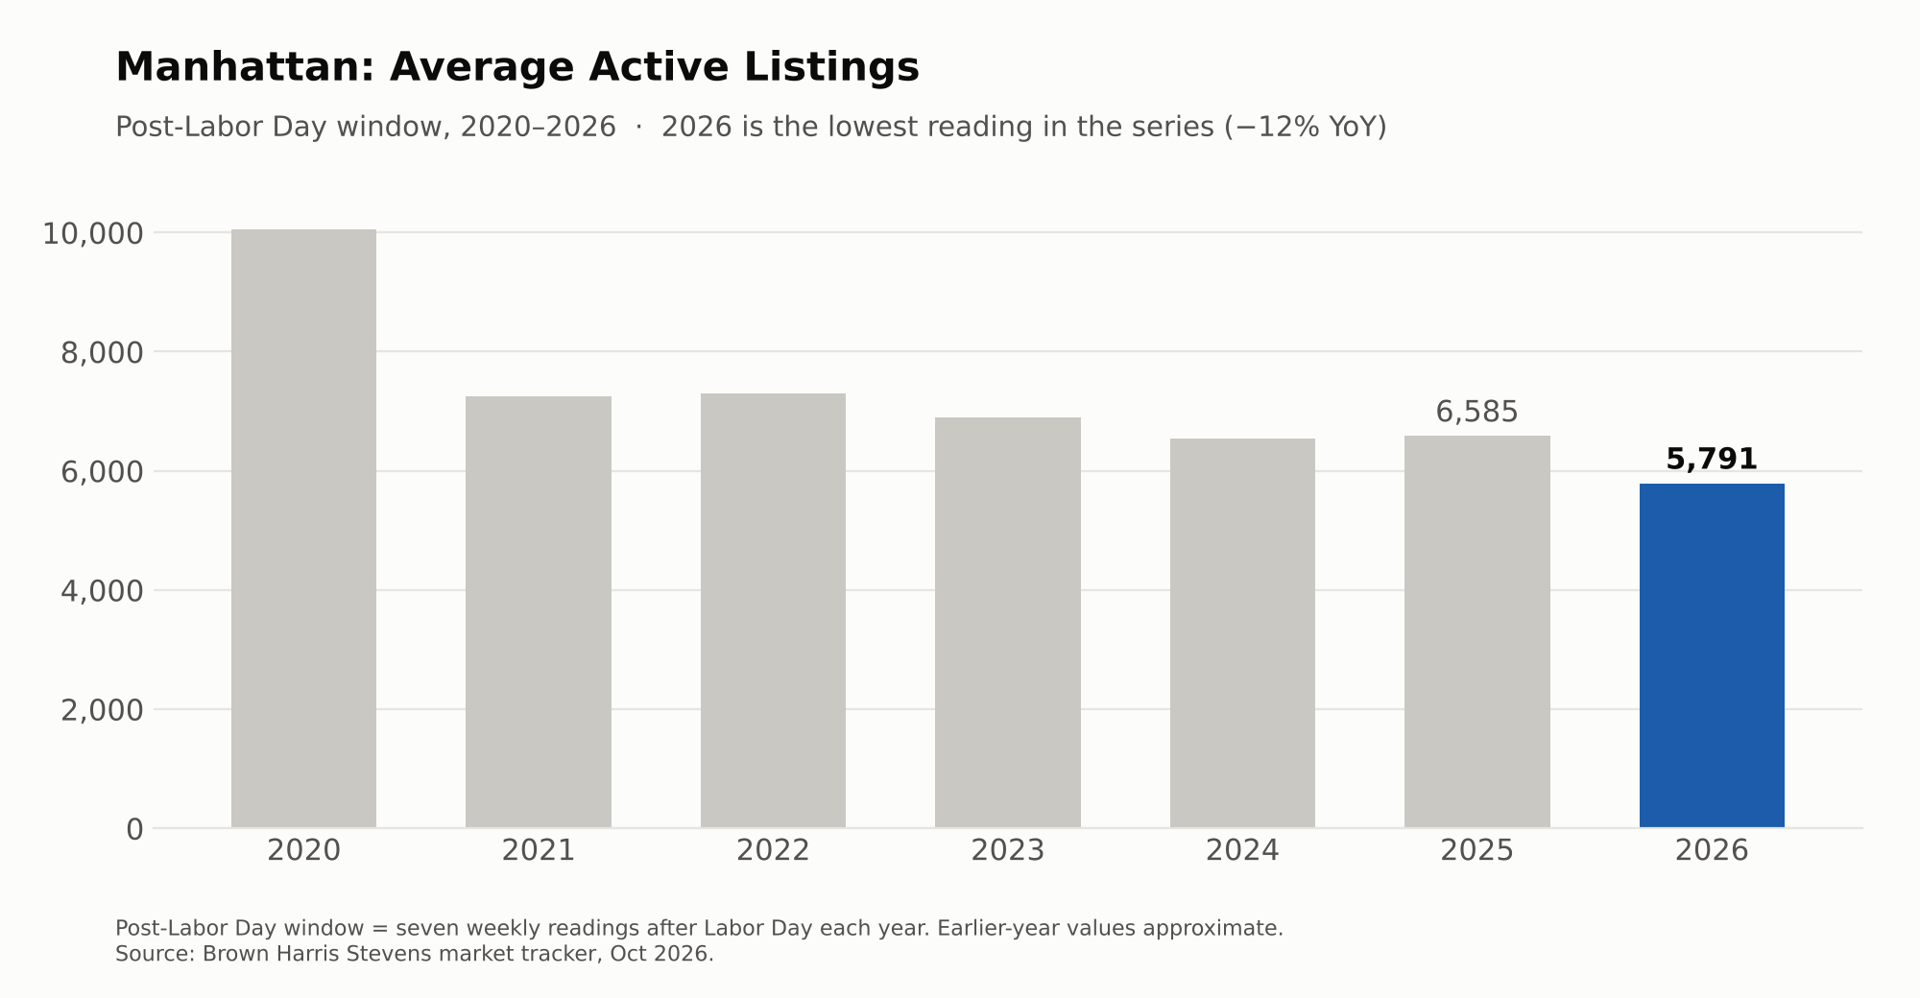
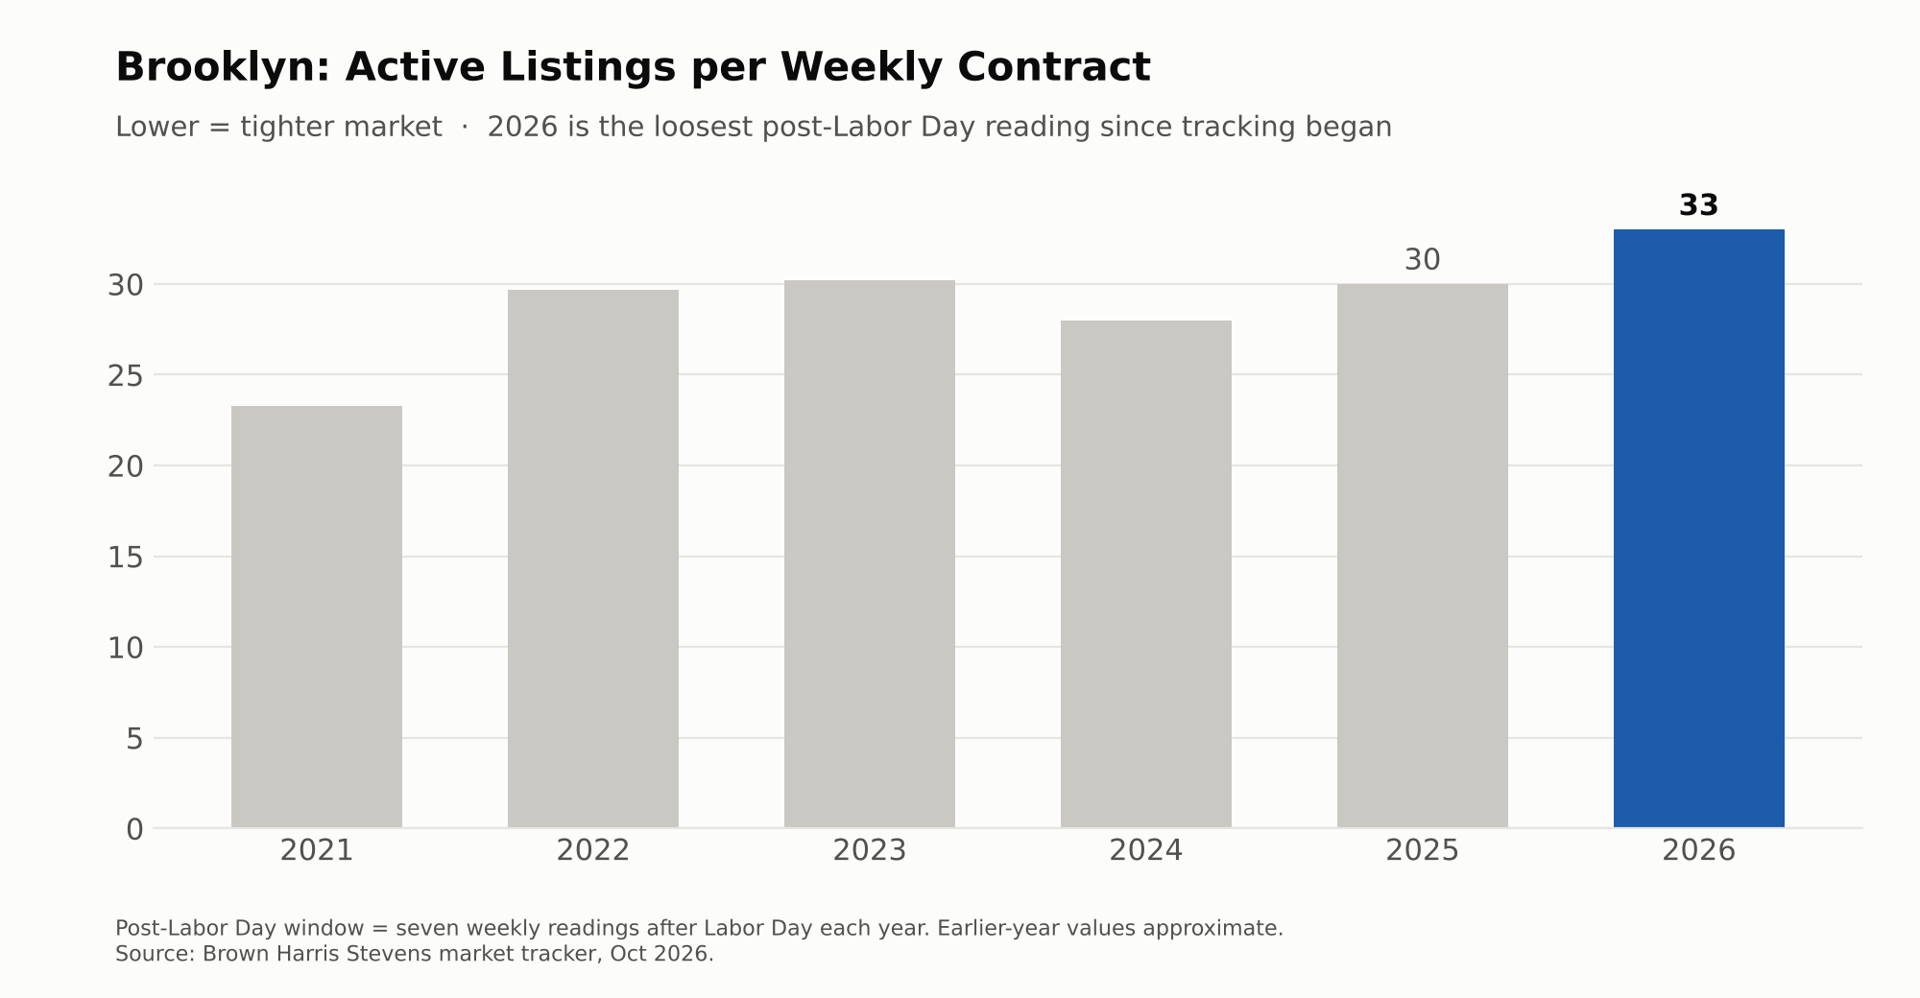
Manhattan buyers have fewer homes to choose from this fall, even though fewer contracts are being signed. The data shows supply and demand have shrunk together. What’s changed is how much of the remaining inventory is already in contract. Conditions also vary a lot by price point, and Brooklyn is heading the other way.
Fewer listings and fewer deals
These figures cover the seven weeks after Labor Day, compared with the same stretch in prior years:
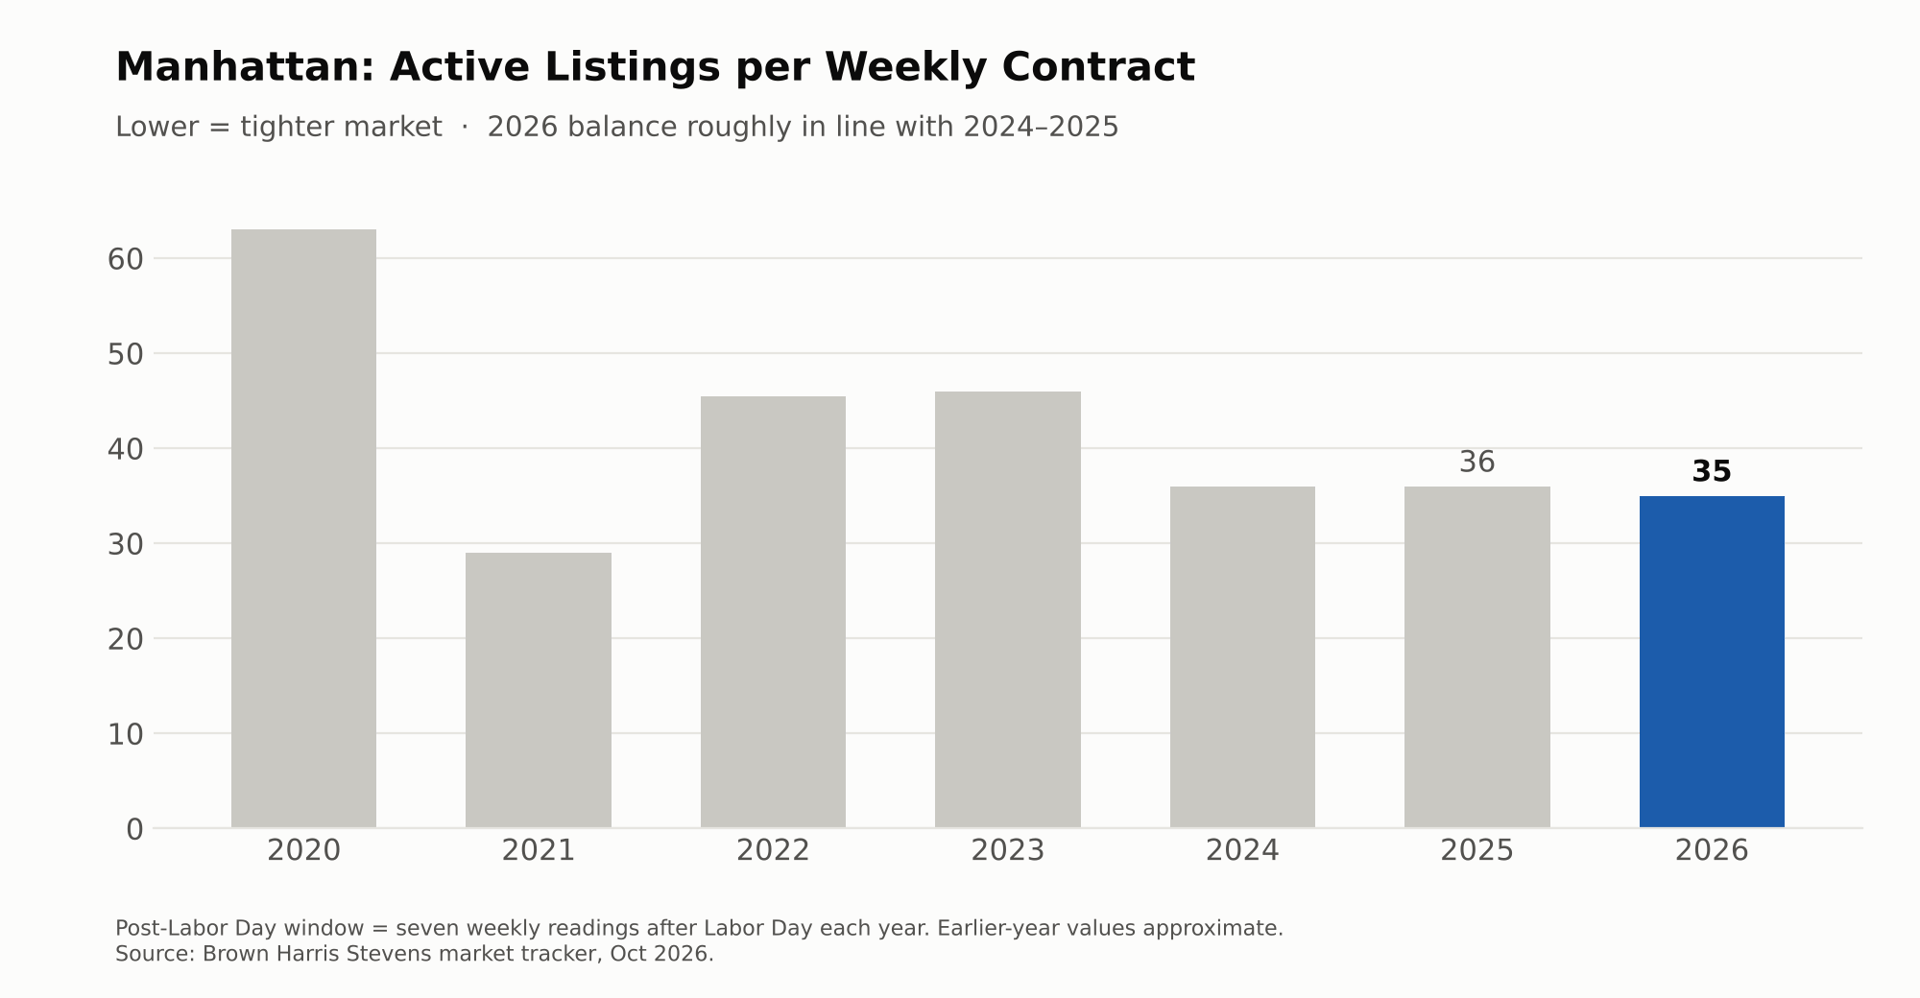
The overall balance hasn’t changed much
Manhattan has about 35 active listings for every weekly contract. That’s in line with 2024 and 2025 (about 36 each) and much tighter than 2022–2023 (45–46). Adjusted for this year’s late Labor Day, the balance looks about the same as or slightly looser than the last two years. So by this measure, the market isn’t tighter than last year.
Why it still feels competitive
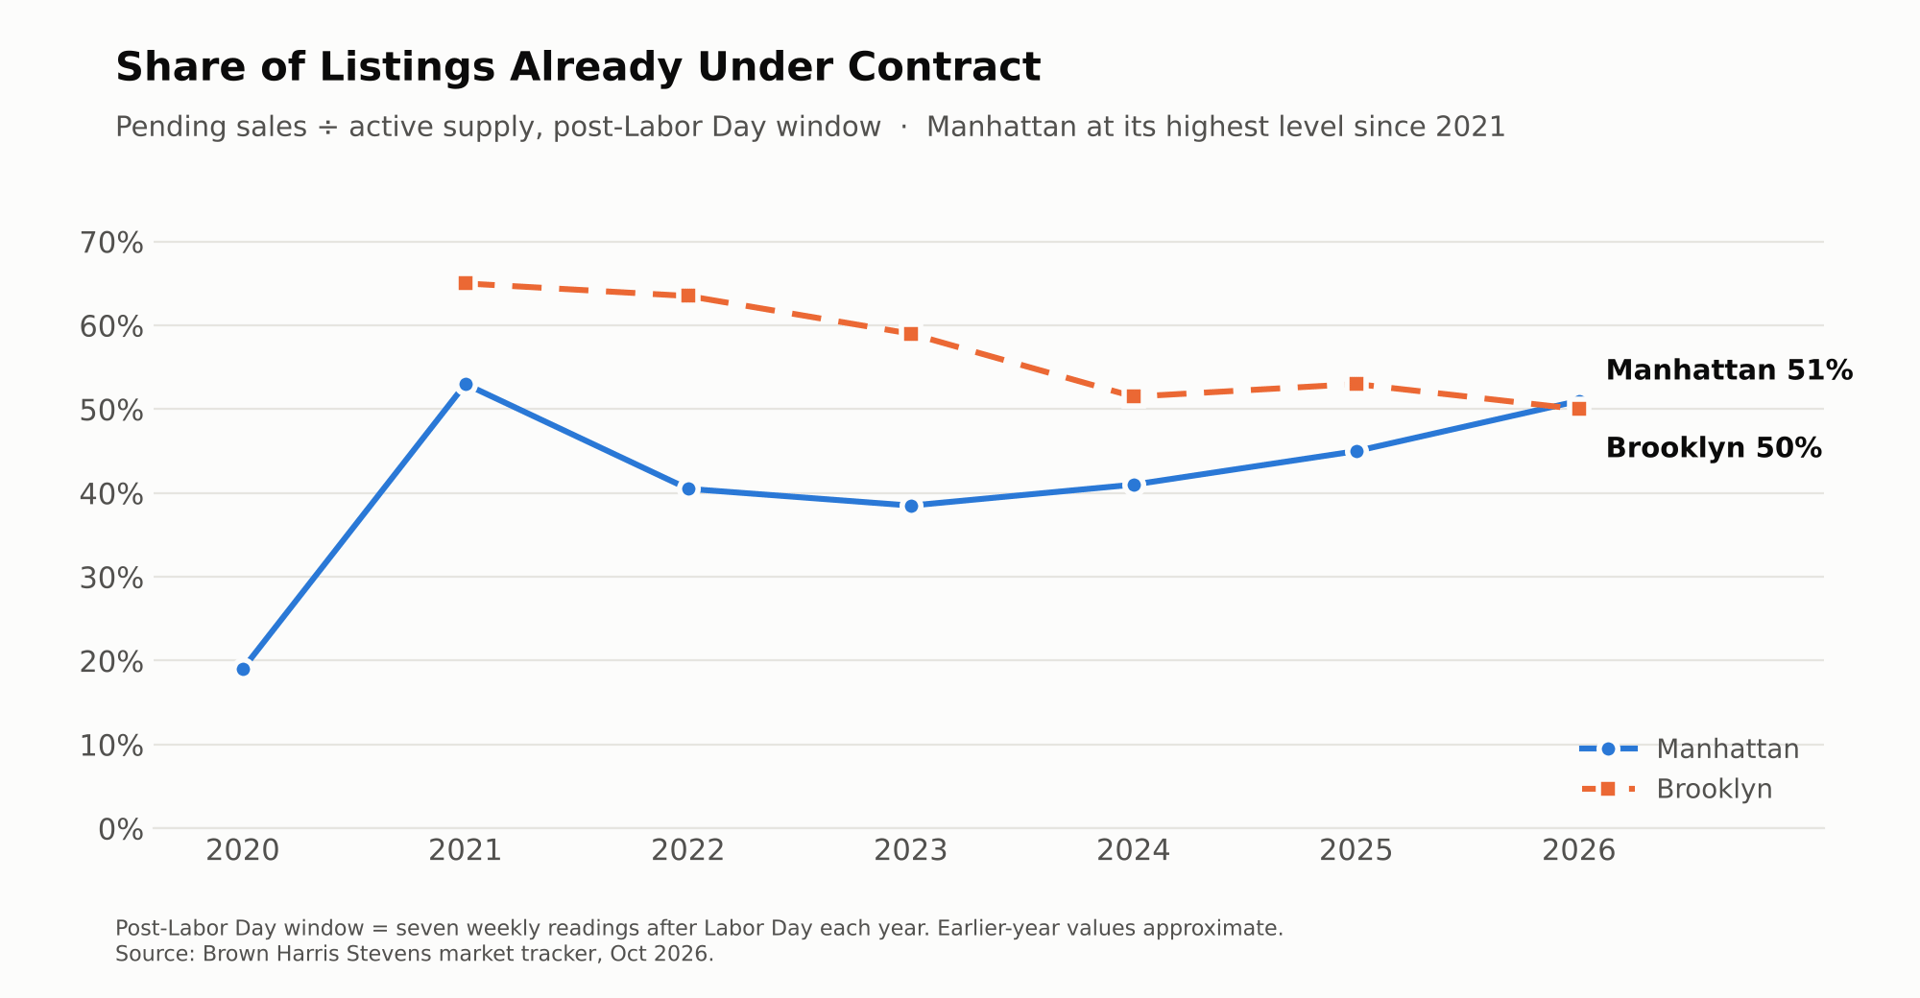
The difference is how much of the market is already spoken for. Pending sales now equal about 51% of active supply, up from 45% last year and 41% in 2024. That’s the highest share since 2021. The pool of available homes has shrunk, while the number of deals in contract has held steady.
New listings averaged 409 a week, down 4%. Many homes were pulled off the market in August, and fewer have come back this fall than expected, which keeps supply tight. Demand also softened slightly relative to new listings: 0.40 contracts per new listing, compared with 0.43 last year.
Condition and price drive results
Renovated, well-laid-out, accurately priced homes are selling, sometimes with multiple bids. Homes that are overpriced, need work or fall short of buyer expectations are drawing little interest. Borough-wide averages hide that gap.
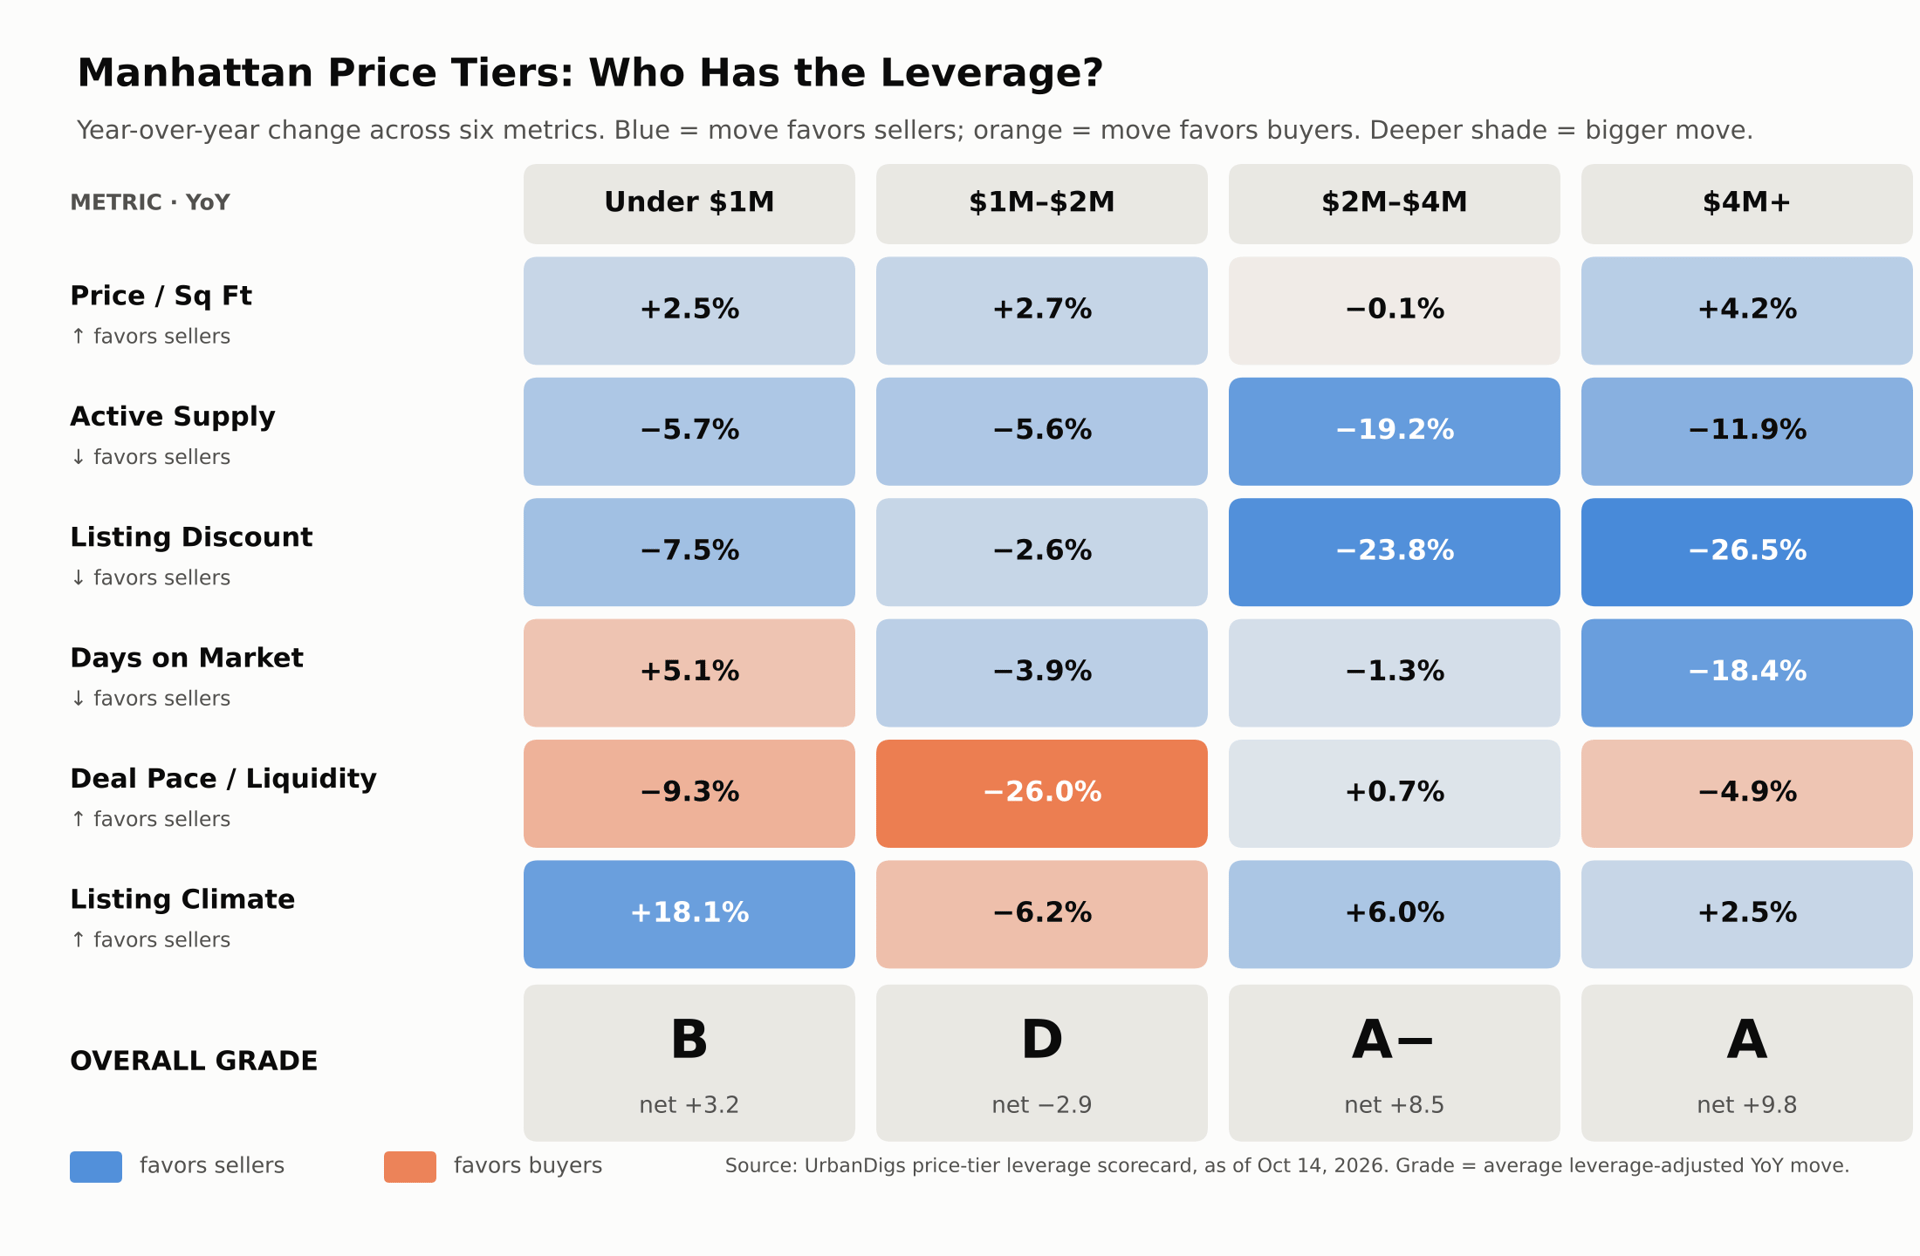
The high end is strongest; $1M–$2M is weakest
UrbanDigs’ price-tier scorecard (as of October 14) compares each tier with a year earlier:
Brooklyn is moving the other way
What it means
Stay up to date on the latest real estate trends.
Market Update
Charlar Acar | November 9, 2026

November 5, 2026

October 29, 2026

Homebuyers
Charlar Acar | October 23, 2026
What You Save, What You Give Up

Lifestyle
Charlar Acar | October 22, 2026

Lifestyle
Charlar Acar | October 15, 2026

Market Update
Charlar Acar | October 10, 2026
Supply Is Still Tight. Buyers Are Discerning. Luxury Continues To Outperform

October 8, 2026

October 1, 2026
For more than 6 years as an ABR, he has merited the trust of his clients and the respect of his colleagues in the real estate industry. He keeps confidences and represents each party with the highest level of service while bringing intelligence and skill to each transaction, large or small.